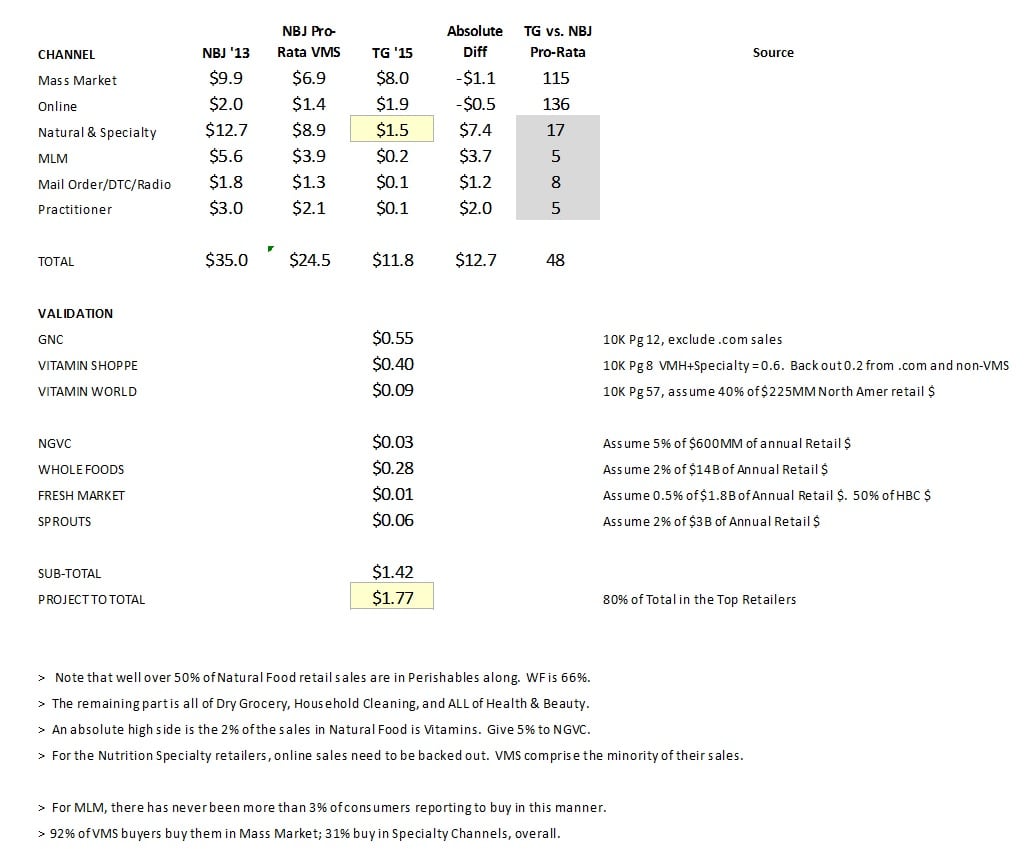
"NBJ's rebuttal doesn’t measure apples-to-apples. They need to back out Sports Nutrition and Meal Replacements, which is about 30% of the total by their estimates. This gets us to a comparison of $24.5B (NBJ) to $11.8B (TG). Not clear why you’d want to include these segments given the differences in forms, Vendor profiles, Retailer shares, ingredients and significant different demographic profile. Nevertheless, I pro-rated the NBJ channel sales for 2013 (that’s all I have available to me) by 70%. That’s what the above numbers reflect.
Point of clarification, TG put a $2.6B estimate on Sports Nutrition, but there is not a confidence interval placed on that until next year. NBJ estimate is over $10B, but there are some definitional variations. Even after that, though, there will still be a substantial disparity to reconcile, but that will have to wait until next year.
John Bradley is correct that disparity is in estimates of Natural & Specialty, MLM and the remaining parts of Mail Order/Radio/Practitioner/Direct-to-Consumer. So let’s address the three elements separately.
Nutrition Specialty Sales are provided in the table at the bottom of this article (click the zoom function for full size) and are footnoted appropriately. Some of the $7.4B disparity has to do with the Sports Nut/Meal Replacement issue, but that would only explain the Nutrition Specialty variance (GNC, VSI and VW). It is the Natural Food estimates that are vastly overstated in the NBJ estimate.
Reading the latest 10K’s by these retailers (Whole Foods, Natural Grocers by Vitamin Cottage, Sprouts and Fresh Market) NBJ is assigning 10% of the retail sales of these retailers to Supplement alone. Considering that almost 60% is just Perishable, their estimate assigns 25% of the non-Perishable sales to Supplements. Think about all of the other things that these retailers sell: Alcohol (Big!), Candy, Salty Snack, Household Cleaners, Spices and Seasonings, Rice and other Side Dishes, Shampoos, Face Creams, and yes, Vitamins, Minerals and Supplements.
As an absolute high side, these retailers would do 2.0% of their sales in VMS category. I’ll give 5% to Vitamin Cottage given its name and heritage. The Big 4 in Natural Foods, then, looks like a more modest $380MM. If the number was that much bigger would Fresh Market have announced that they are discontinuing ALL Health & Beauty? Even with the huge margins in Vitamins, they didn’t generate enough volume to warrant keeping them.

With respect to MLM who and where are all of these people doing $5.6B of Vitamin Sales? Since 2005 TABS Group has never had more than 3% of category buyers say they buy from this outlet, with the average over that time being less than 2%. Compare this 2% to the 92% that state that they buy in Mass Market and the 60% say they buy there exclusively. How then, do we get to MLM at $5.6B and Mass Market at $6.9B (both pro-rated numbers)?
The answer for much of this disparity is that NBJ is measuring what is being shipped out, but not what is being sold through. Indeed there has been a year’s worth of financial media stories focused on the MLM industry and the fact that most of those sales and being absorbed by their distributors, not the end-consumer.
Mail Order dried up significantly in our study once Internet sales became a major factor in the category about three years ago. Practitioners and Direct-to-Consumer (DTC) have never registered any meaningful feedback from our study as being a meaningful outlet for purchasing Vitamins. We always provide the ability for respondents to add outlets not captured in our list. That is how we discovered Swanson Vitamins as a meaningful player in Online sales. No such responses have presented themselves for Practitioners and DTC.
In Natural and Specialty retail it is much the same. Go to any of these retailers and you find a vast assortment of product: thousands of SKU’s. Sprouts proudly proclaims 4,700 SKU’s in their stores and there may be twice that in VSI and GNC. The dirty little secret is that the majority of the SKU inventory represents years, if not decades, of inventory.
Using our Sprouts estimate of $60MM in retail dollars, we estimate they turn their 4,700 SKU’s of inventory about 1x per year. Given the very high margins and dollar rings on these products, that’s probably acceptable to them, and those turns aren’t that much different than a typical Drug Chain. NBJ estimates Sprouts turns the merchandise 10x! That is virtually impossible. If the turns were that high for this highly profitable category then they would expand their SKU count to 25 or 50,000 because the Inventory Return (GMROII) would be off the charts.
So yes, based on this approach our initial estimate of $1.5B for Natural & Specialty seems a bit low, but we wanted to stay true to the model to get a more accurate aggregate number. That higher number would also assume the 2.0% of retail sales assumption for Natural Foods. Even under that assumption, however, that higher number may be in the $1.8-2.0B range, not $9.0B!"

