Data presented during the TABS Group 8th Annual Vitamin and Sports Nutrition Study sponsored by the Promotion Optimization Institute and hosted by Supermarket News also indicated that the sports nutrition retail sales category is worth an additional $2.6 billion.
“Our first study in 2005 set out to prove the prevailing industry estimates of a $25B+ category size were vastly overstated,” said Dr Jetta. “This overstatement had then, and still has today, a harmful effect on many industry participants, primarily through the misallocation of capital by overspending on production capacity.
“We hope that by setting the record straight, that industry sales are less than half of what is published through other sources, industry participants can make better decisions on how they invest their resources.”
Methodology
“My methodology is visible and subject to scrutiny,” Dr Jetta told us. “The NBJ estimate is a total blackbox with just a minimum of explanation.”
Dr Jetta splits the market between FDMCD (food, drug, mass, club and dollar) and non-FDMCD (specialty, natural food, online, catalogue, MLM and other). Sports nutrition is defined as performance and protein powders, drinks and pills (but excluding energy bars and shots and products such as Gatorade).
“Basically we take what is known - VMS sales in Food/Drug/Mass/Club/Dollar – and try to project that to the entire universe. In other words, does FDMCD make up 20% of the Total Category or 70%? We use survey research to make that projection.
“First, we make sure that survey responses correlate highly to what is known. e.g. survey said GNC and Vitamin Shoppe were down, and their quarterly earnings call confirmed this. Survey data says Walmart and Rite Aid up quite a bit, and Nielsen data confirms this. Once we have confidence in the survey responses we use this to project non-FDMCD sales.

“With confidence in the survey we find that 76% of transactions are done in the tracked universe and roughly 67% of dollars. There’s a bit of proprietary modeling and secret sauce in how we get to those exact numbers, but consider a few facts that haven’t changed much since 2005 when we first did the study:
- 92% of category buyers say they but at least once in FDMCD in a year.
- Only 31% of category say they buy VMS in non-FDMCD in the last year.
- Only 8% say they buy exclusively in non-FDMCD.”
And with this methodology, Dr Jetta arrives at an industry of $11.8 billion, which is growth of 3% from 2014.
Study highlights
Diving into the data, Dr Jetta told attendees to the webinar that the past year’s data revealed a slight drop in penetration, he said, from 75% to 74%. The most significant drop was seen in heavy users.
Male users increased significantly in 2014 but that jump proved to be temporary, he said, with that dropping this year, particularly for male heavy users.
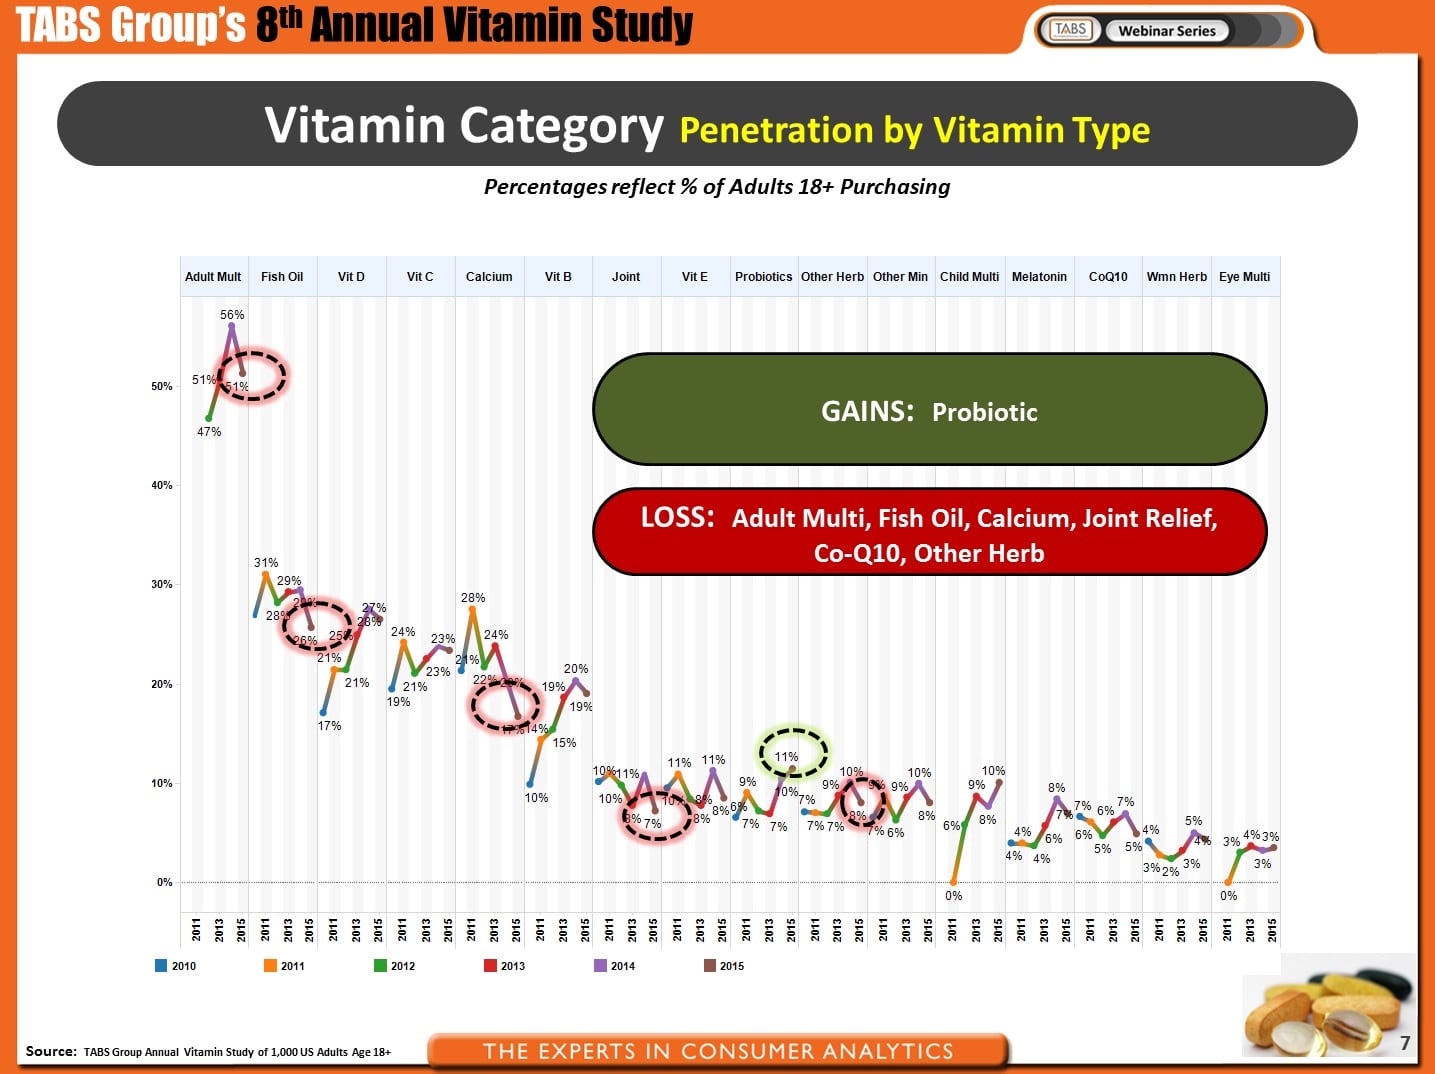
Probiotics were the only product type that saw substantial growth, he said. Adult multivitamins, fish oil, calcium, joint relief, CoQ10, and other herbs displayed flat or shrinking penetration. (see figure 1 below)

Online and the role of promotions
From a retail channel perspective, FDMCD accounts for about 66% of retail dollars, said Dr Jetta, with Walmart, Costco, and Rite Aid the big gainers in the market. These three mass market leaders combined to account for $3.4 billion in sales representing 29% of all vitamin sales.
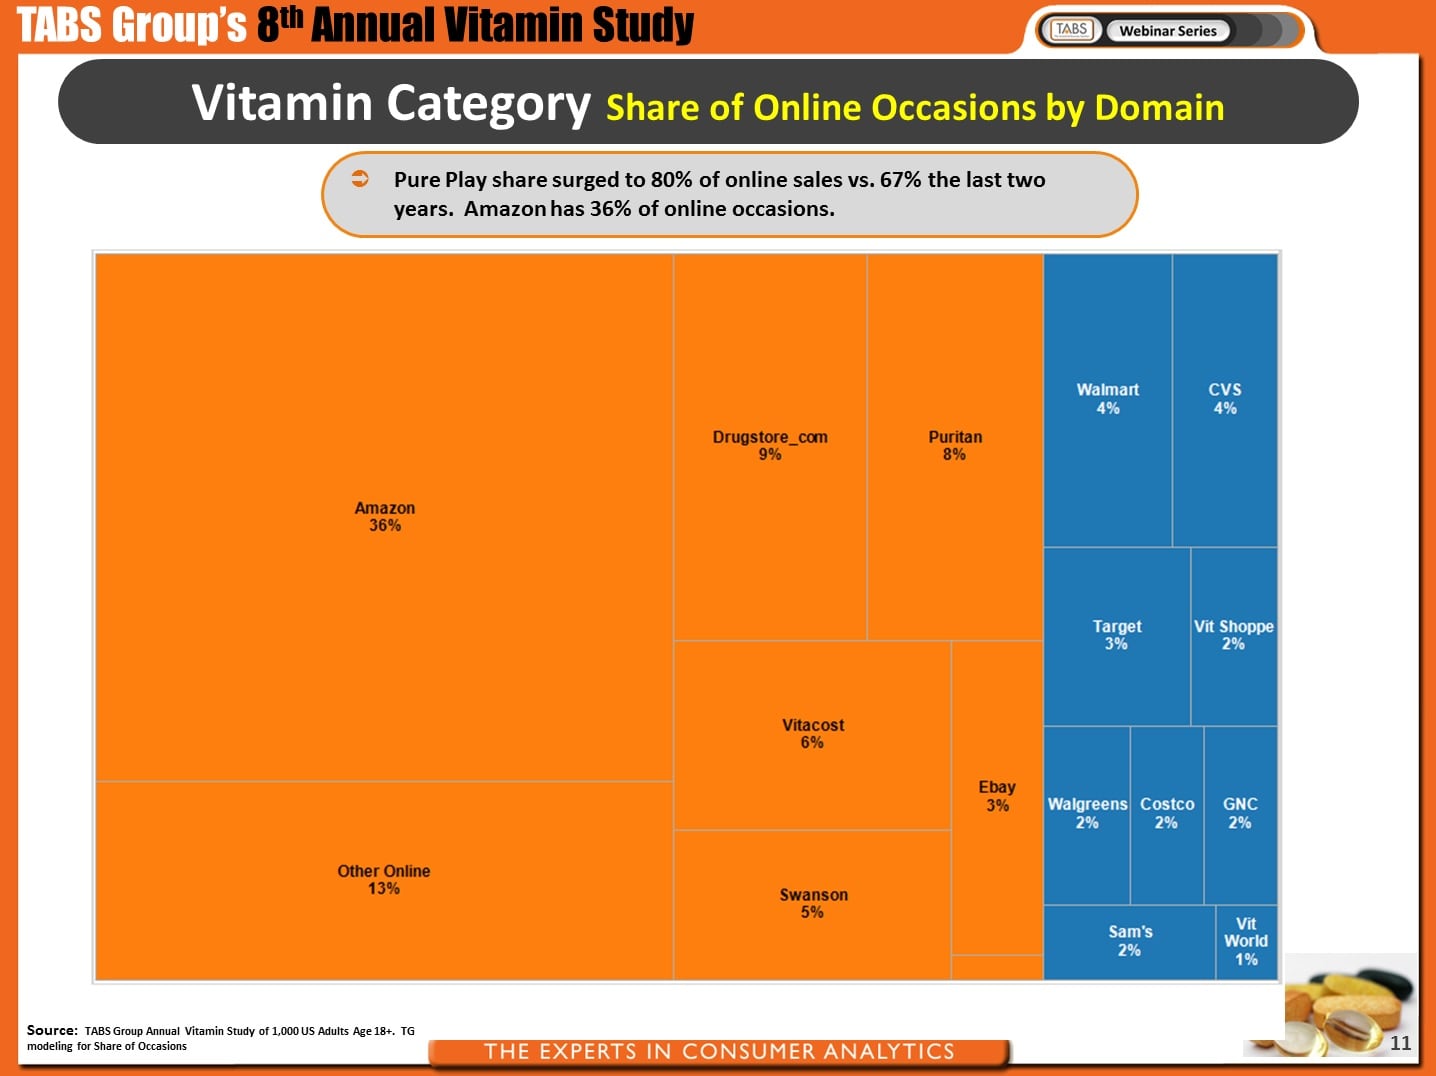
While online is the number one outlet, and is dominated by pure play online retailers (versus retailers with both an online and a bricks-and-mortar presence), there was a decline in the size of this sector, he said. Pure play online retailers share surged to 80% of online sales versus 67% in 2013 and 2014. The largest online retailer is Amazon, with 36% of the sector (see figure 2 below).

Online vitamin sales hit $1.9 billion surpassing Walmart’s sales of $1.7 billion in 2014, a slight increase over 2014. However, online’s share of occasions (a proxy for share) of the vitamin category dropped from 9.9 in 2014 to 9.7 in 2015, the first time online share has dropped since the inception of the TABS Group survey in 2005.
“All online outlets saw declines with the primary cause being the drop in sales among heavy buyers. Amazon’s decline in share was much less pronounced since it draws a disproportionate amount of its sales from light buyers,” said Dr Jetta.
“Given that vitamins is among the most highly developed online categories in the consumer packaged goods (CPG) industry, this study adds an important data point that suggests online sales in CPG have peaked with the existing online shopping technology.”
Retailer Promotions have helped to prop up sluggish trends in the mass market, noted Dr Jetta, and promotional activity continues to have high explanatory power for mass market trends.
“Deals drive more purchasing among heavy buyers, particularly active tactics,” he said. Active tactics relate to promotional efforts from one retailer that specifically target the consumer outside the store, such as circulars, online coupons, loyalty card, etc. On the other hand, passive tactics relate to promotional efforts such as everyday low price, bonus packs, and value size products.
“Promotional activity was cited as a cause for sales softness among some specialty retailers,” he added. Mike Archbold, CEO of GNC, recently noted that the company did not “adequately assess” the impact of the previous year’s promotions, which contributed in some way to its ‘self-inflicted’ & ‘disappointing’ Q1.
“The channel shift from online to mass market affirms the importance of retailer promotions in driving sales. If compelling deals are not available, many consumer just won’t buy. Our investigation of online promotional practices suggests that online outlets are not competitive promotionally,” said Dr Jetta.
Sports nutrition
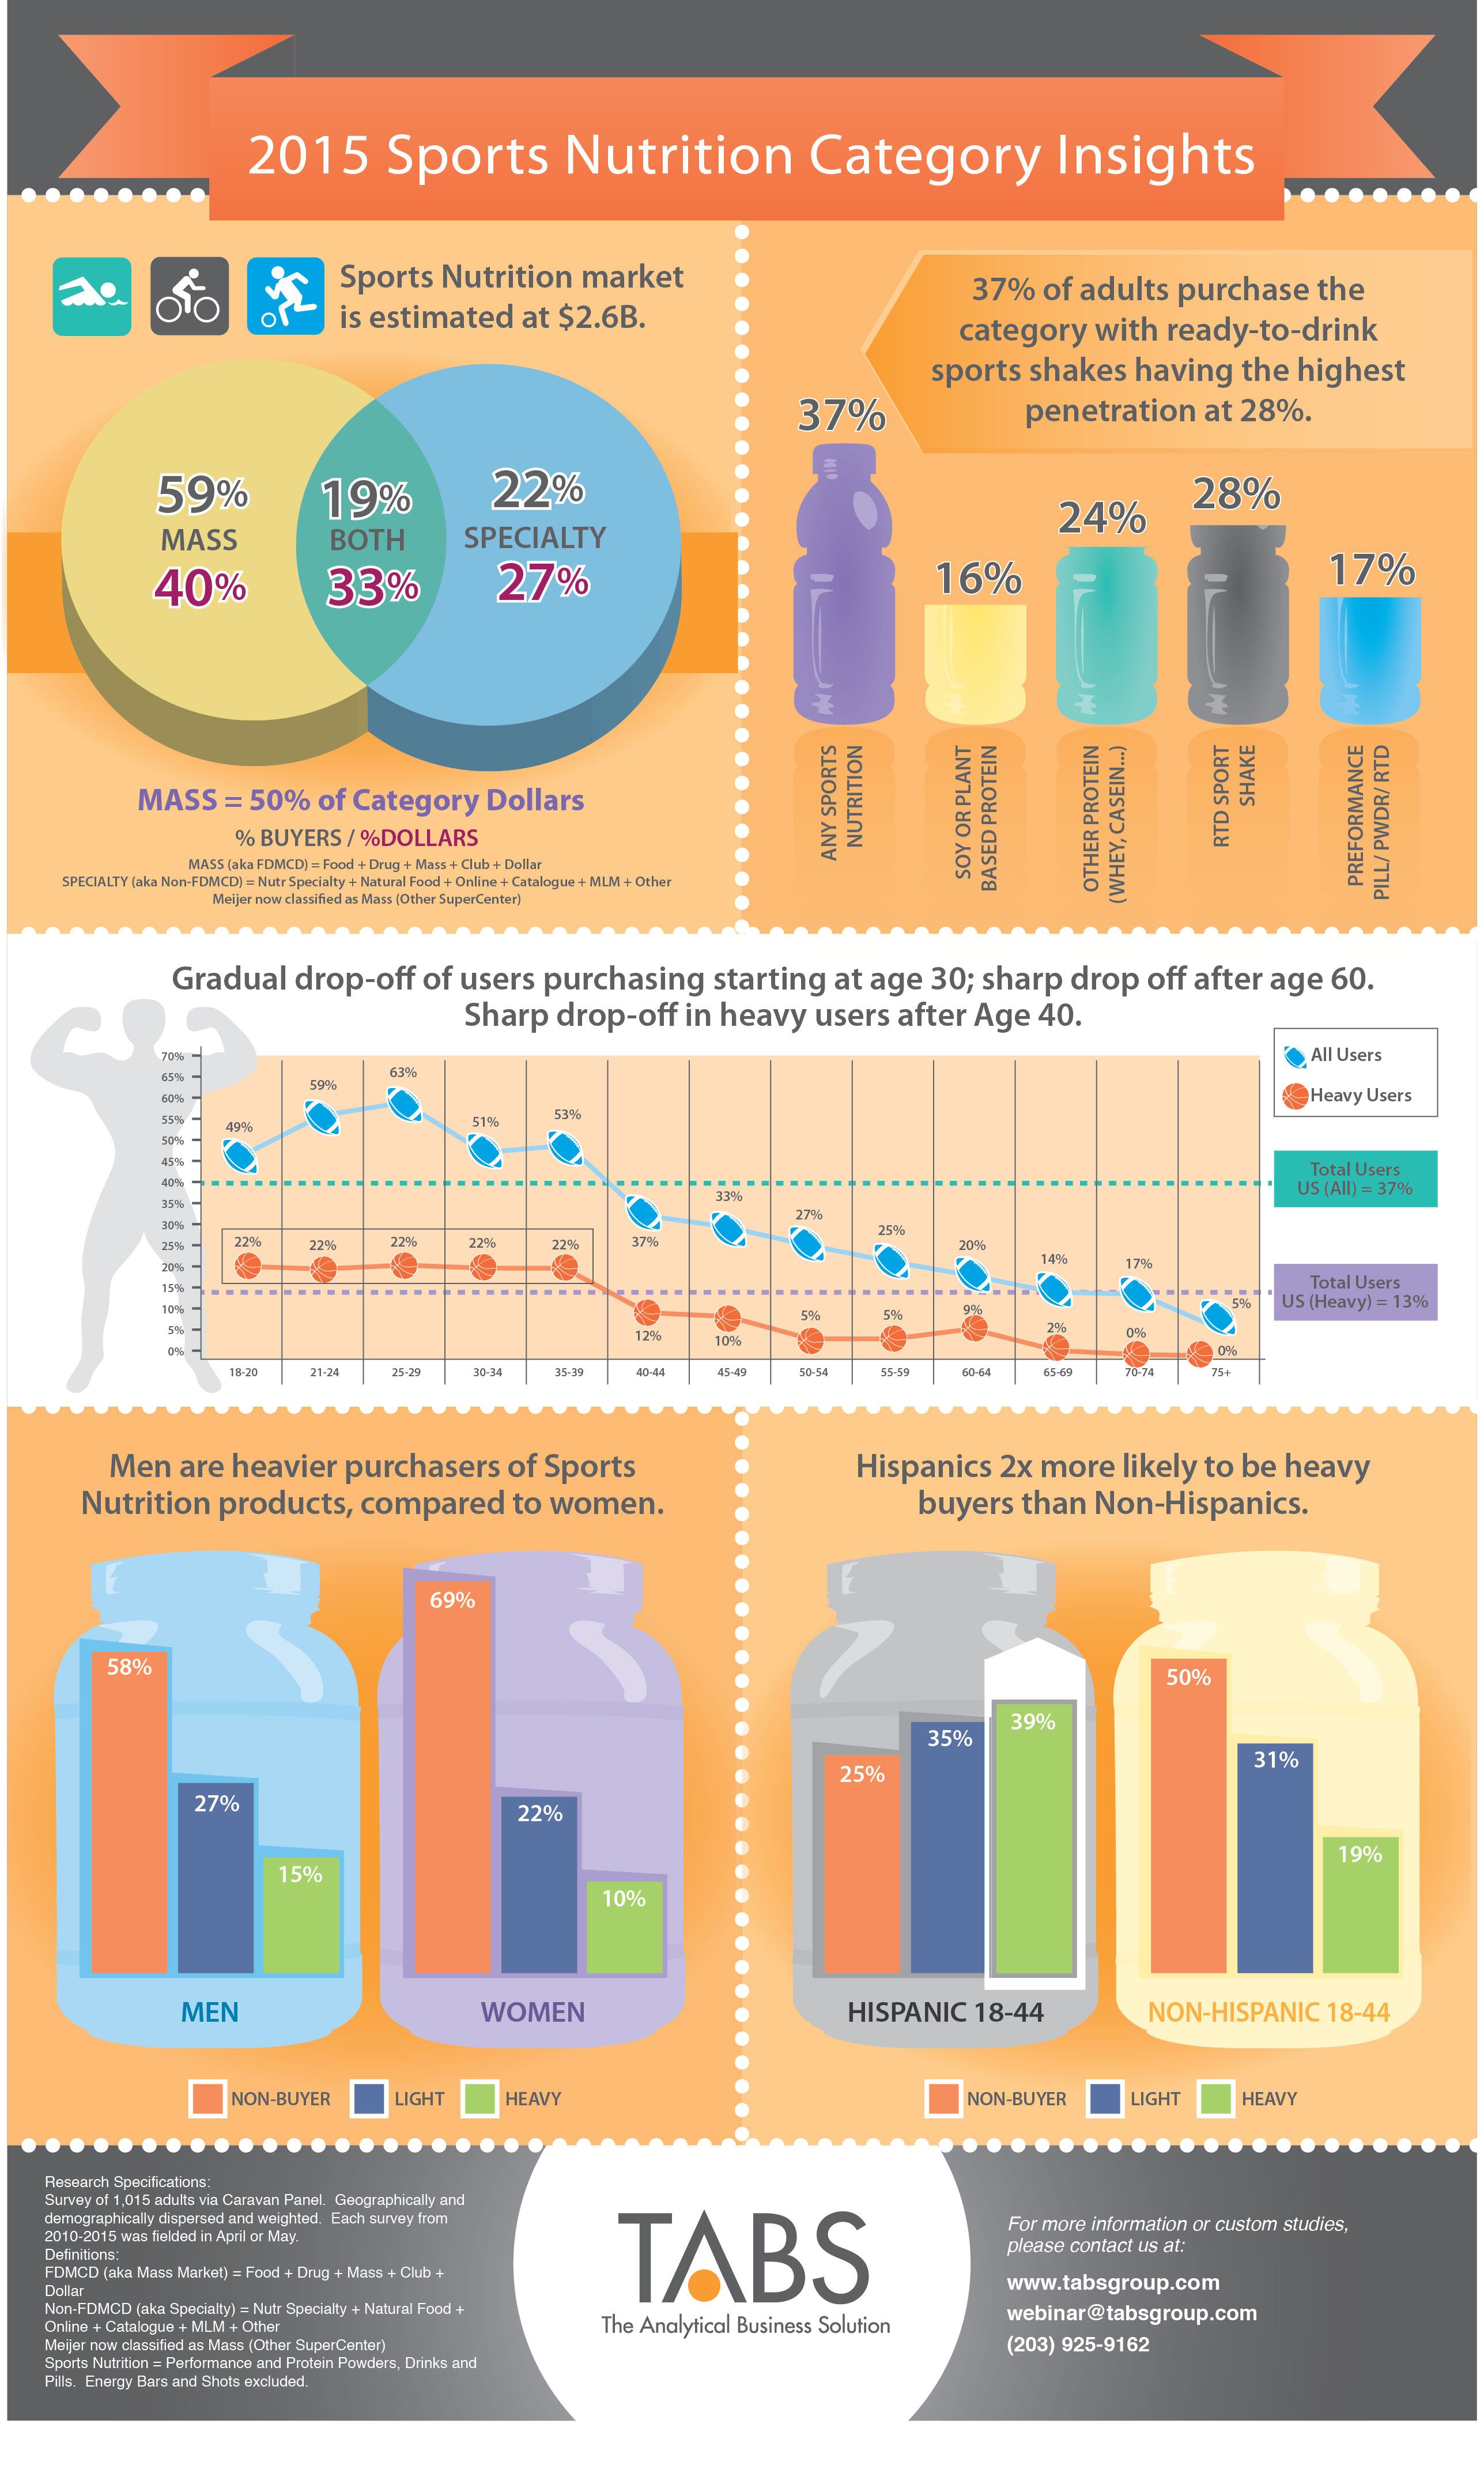
Looking at the $2.6 billion sports nutrition sector, Dr Jetta’s research found that heavy usage of these products was significantly higher among men than women, but women were still an important demographic. There was also a significant and sharp drop-off in heavy usage in consumers over the age of 40, he said.
Ready-to-Drink Shakes are the most popular segment with 28% incidence and 35% heavy usage, and 50% of category sales occur in the mass market.
“The results from the survey highlight that sports nutrition is a category deserving of more space and support in mass market outlets,” said Dr Jetta. “With half of all sales already occurring there, that number has considerable upside, particularly given retailers focus on millennials. Furthermore, unlike almost any other category of CPG, sports nutrition is an efficient way for retailers to appeal to Hispanics.”
For more information about sports nutrition, please see the infographic below.
General outlook
Overall, there is a dearth of innovation in the sector, said Dr Jetta. “Gummies were the last big innovation,” he told us. “Probiotics are a bright spot, but other than that it’s waiting for the next big ingredient or innovation.”
To request the “TABS Group Vitamin and Sports Nutrition Study” please email: webinar@tabsgroup.com


